5 Conclusion
In conclusion, the univariate analysis showed that not all fitted models are suitable for every variable.
Regarding the College dataset, the application of PCA is not entirely appropriate since the variables with the strongest correlations represent subsequent stages of the admissions process (such as Apps, Accept, and Enroll). The first two principal components alone are insufficient: to reach 80% of explained variance, at least six components are required.
However, by applying Kaiser’s rule, it is possible to reduce the dimensionality of the dataset to three meaningful principal components:
- PC1 – Academic Prestige and Student Spending: Captures the level of academic prestige and quality of a college. Higher values correspond to selective institutions with strong resources and qualified faculty.
- PC2 – Size and Enrollment Volume: Reflects the size of the institution and the scale of its admissions process. Lower values indicate larger colleges with high enrollment volumes.
- PC3 – Personal and Book Expenses: Represents student-related out-of-pocket costs. Negative values indicate higher personal living and study material expenses.
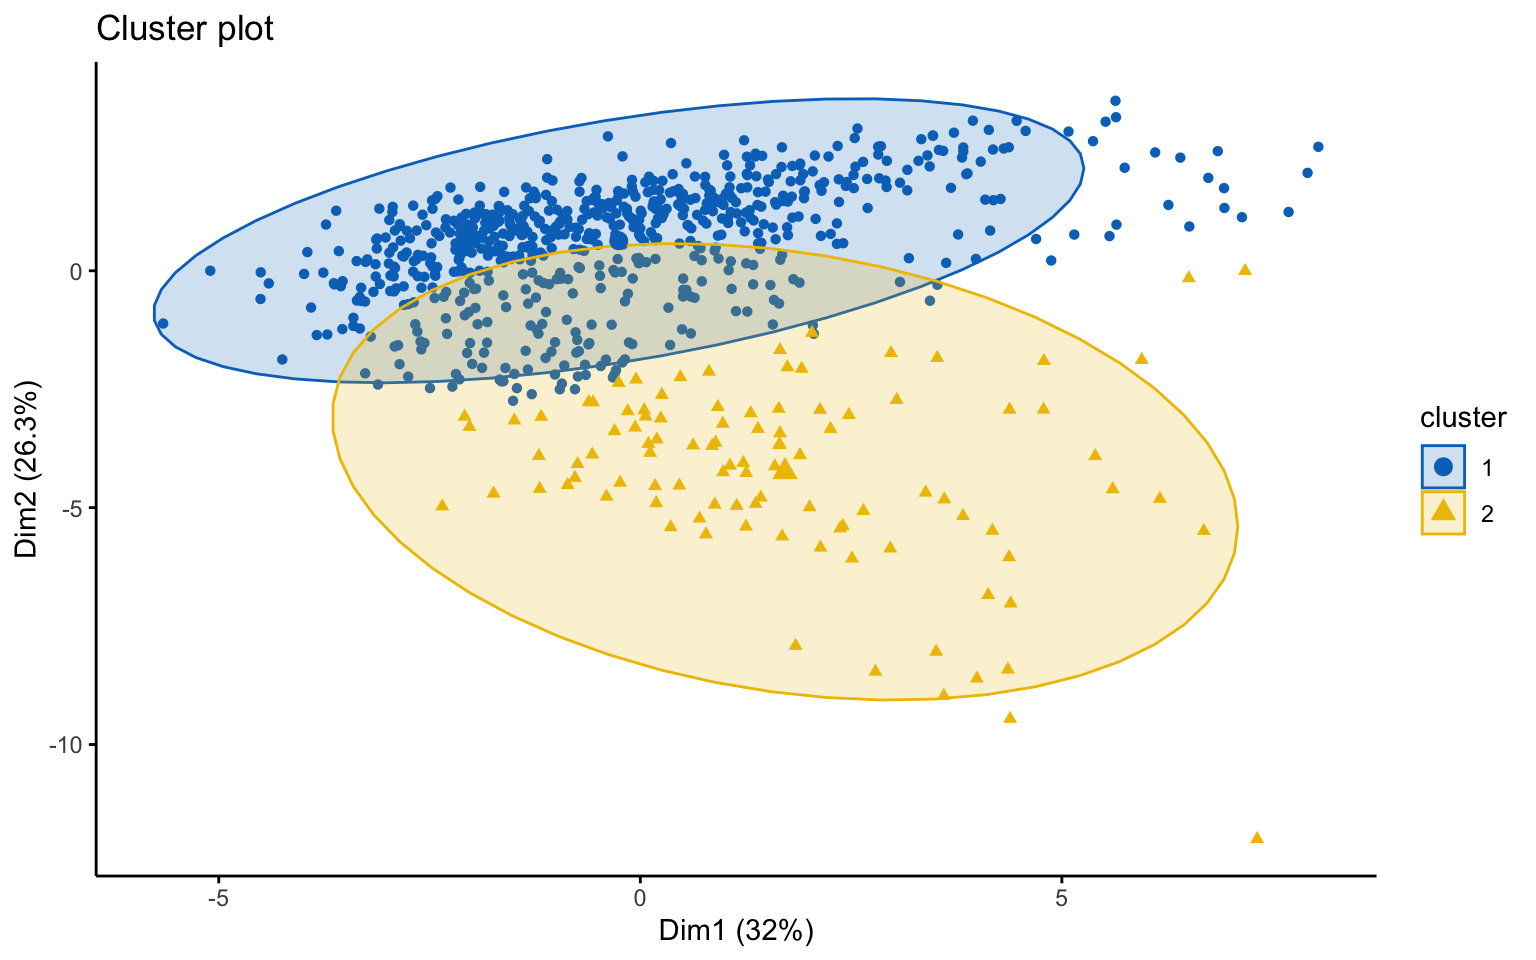
Finally, the clustering analysis revealed that the most effective algorithm was k-means++, which identified two clusters that aligned well with the distinction between private and public colleges.
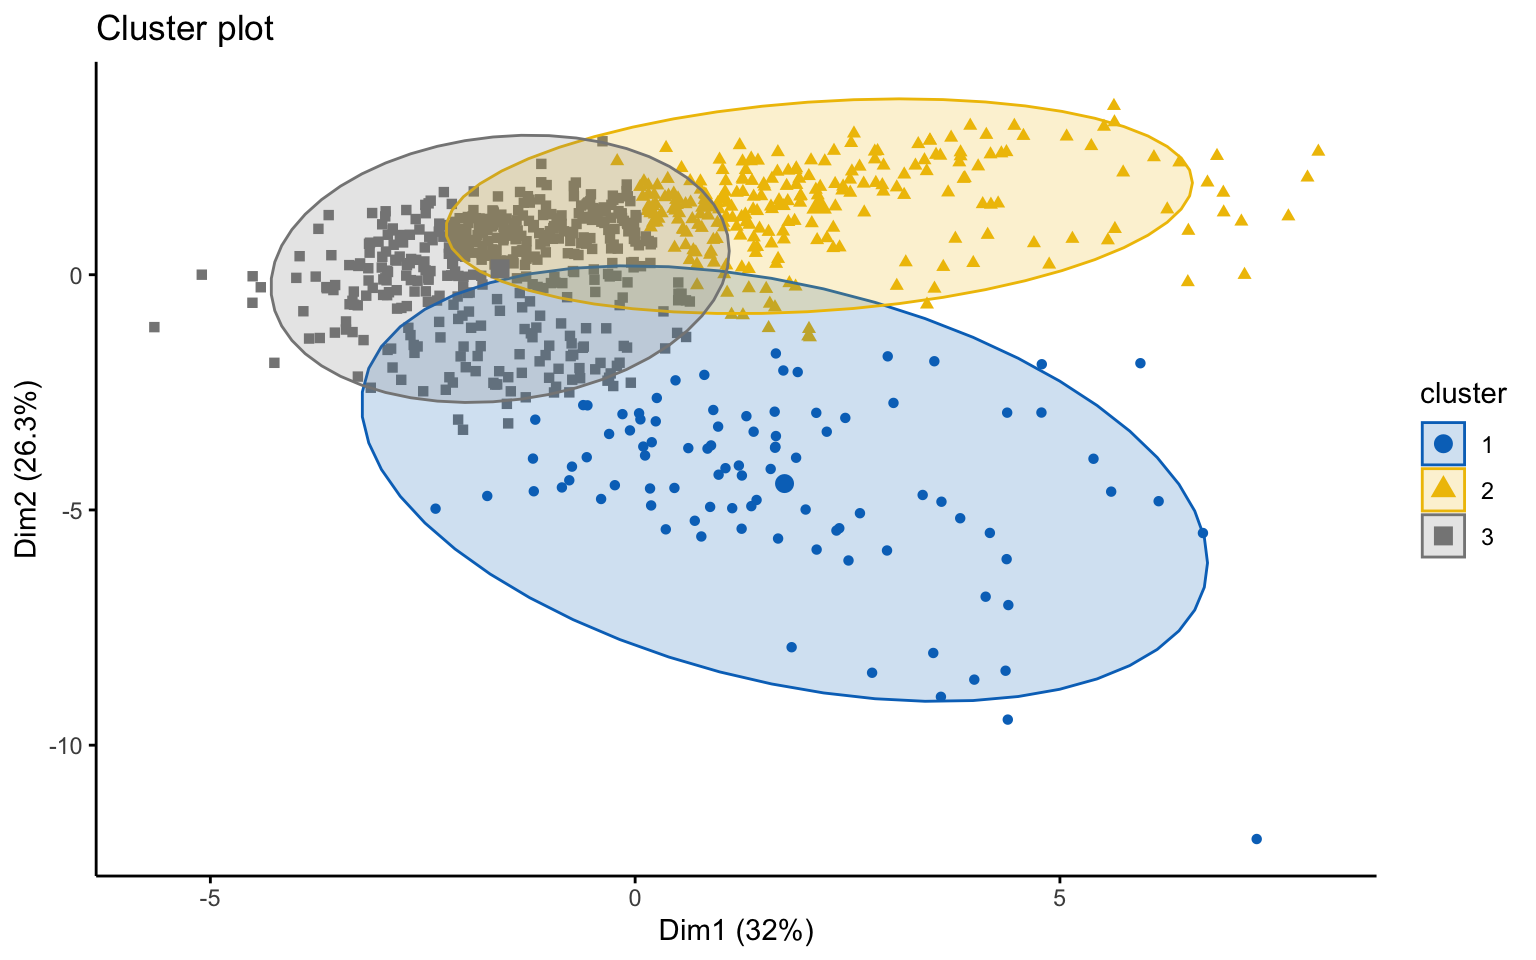
The classic k-means with three clusters, however, uncovered additional patterns:
- Cluster 1 (blue): Located at the lower end of PC2, grouping larger institutions with high enrollment volumes, but not necessarily characterized by high academic prestige.
- Cluster 2 (yellow): Shows higher values on PC1, representing selective and prestigious universities with better resources and faculty quality.
- Cluster 3 (gray): Positioned closer to the origin, representing medium-sized institutions with intermediate levels of prestige.