3 Dimensionality Reduction
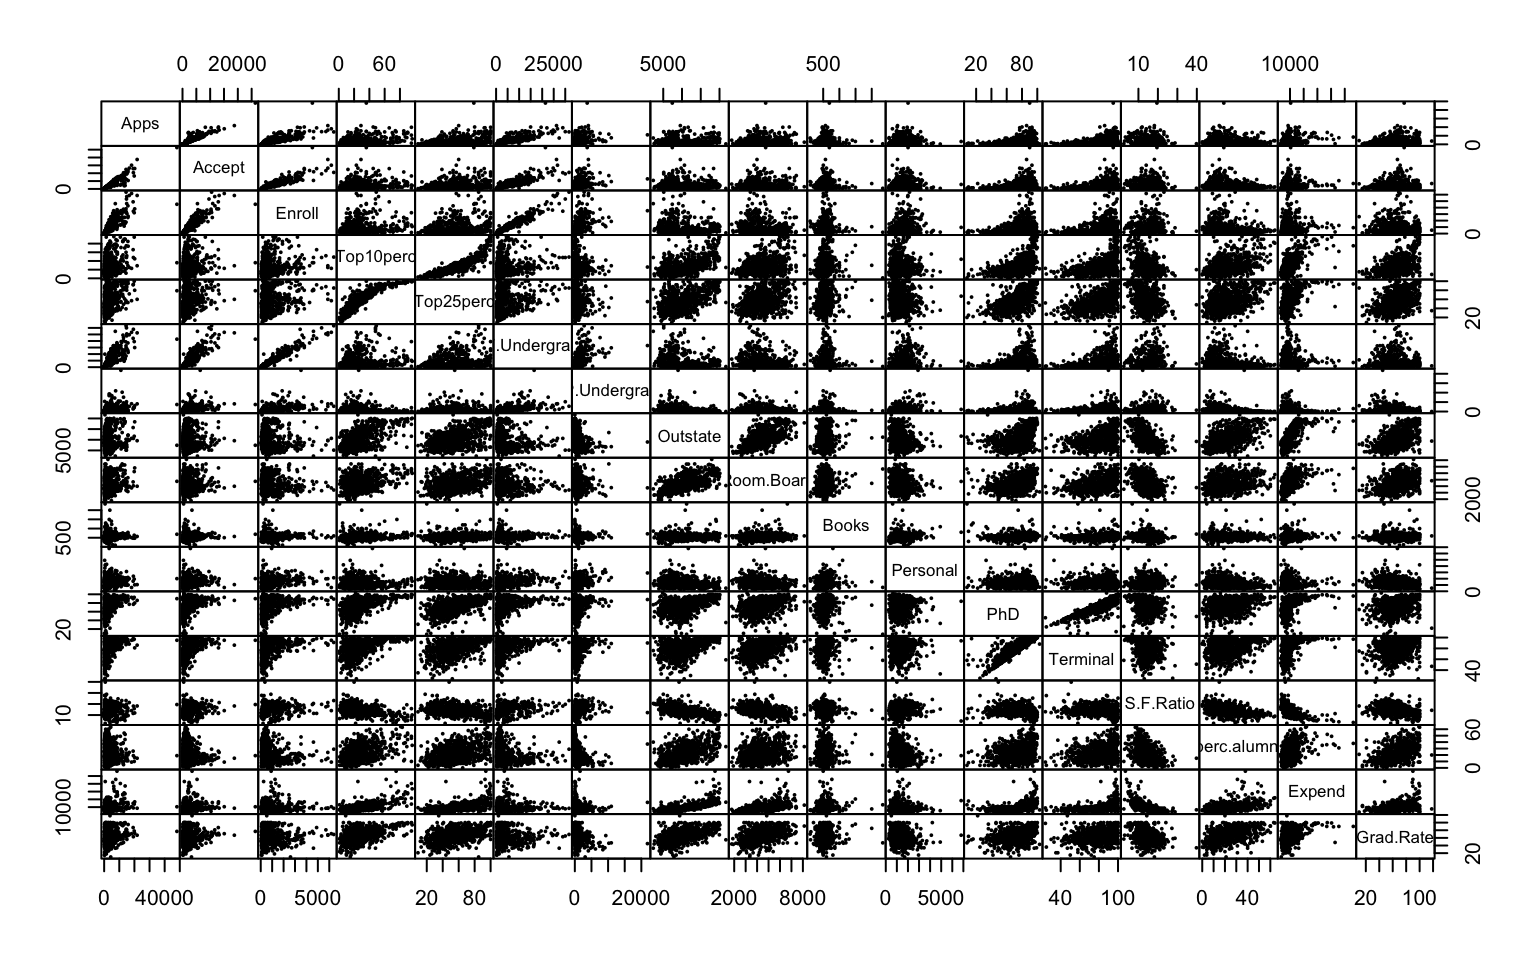
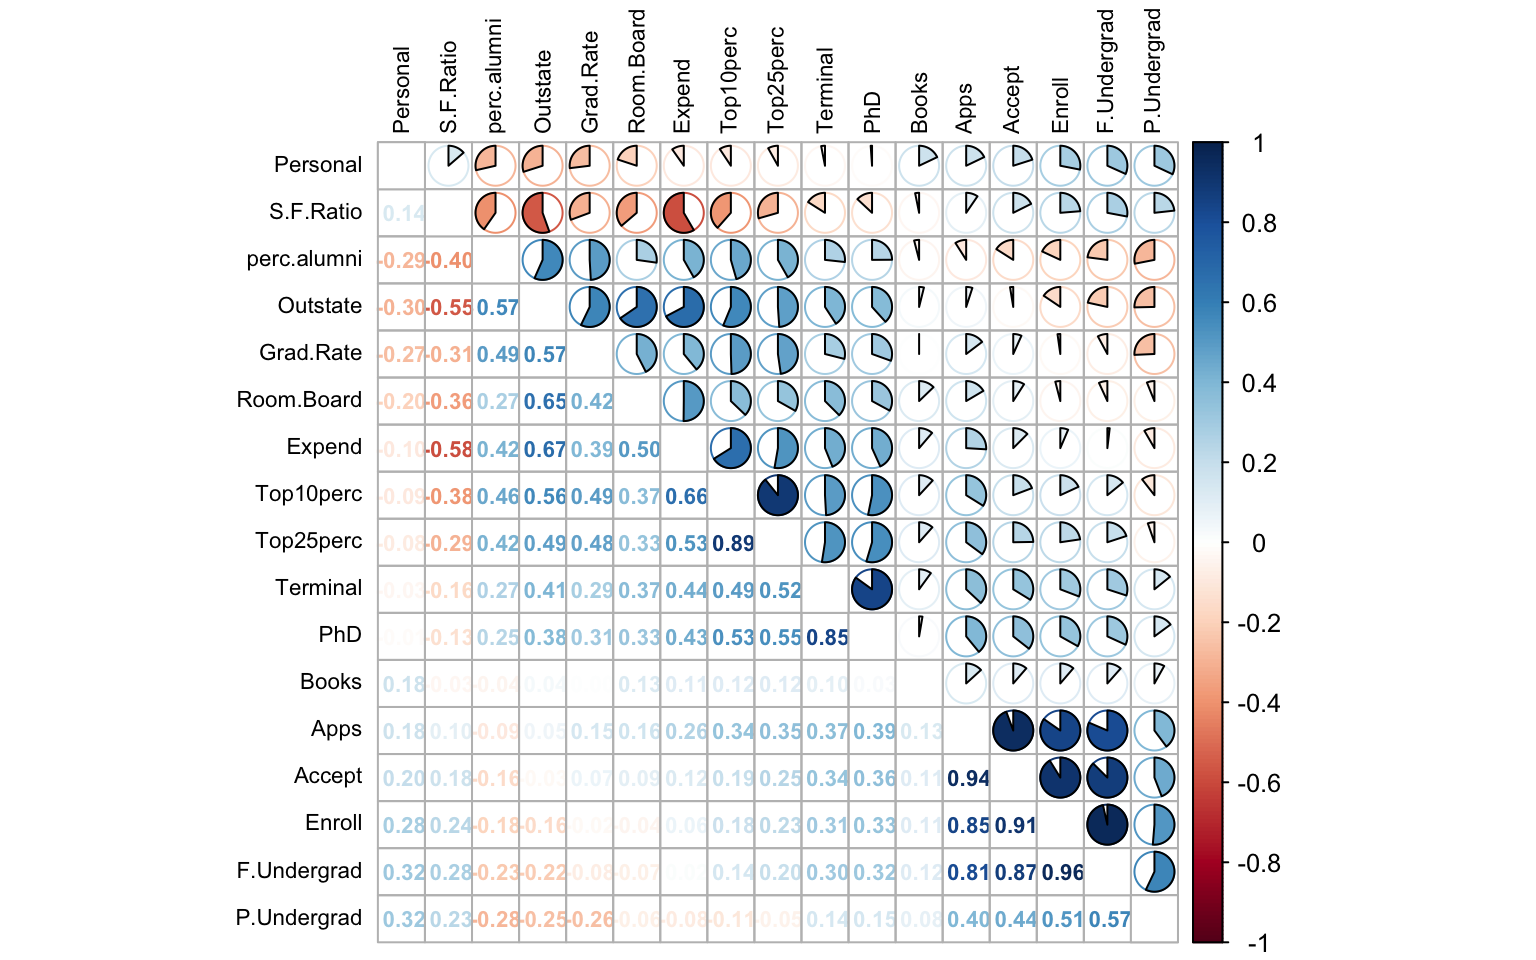
The exploratory analysis of the relationships among the variables highlights a strong presence of both positive and negative correlations. In particular, very close relationships are observed among Apps, Accept, and Enroll, which represent subsequent steps of the admission process, and between Top10perc and Top25perc, both measuring the academic quality of incoming students. Furthermore, Terminal and PhD appear to be almost perfectly correlated, while a significant negative correlation emerges between Expend and S.F.Ratio, suggesting that universities with higher expenses tend to have a lower student-to-faculty ratio. These findings reveal a considerable degree of redundancy in the data, thus making dimensionality reduction techniques such as PCA particularly suitable.
PCA (Principal Component Analysis)
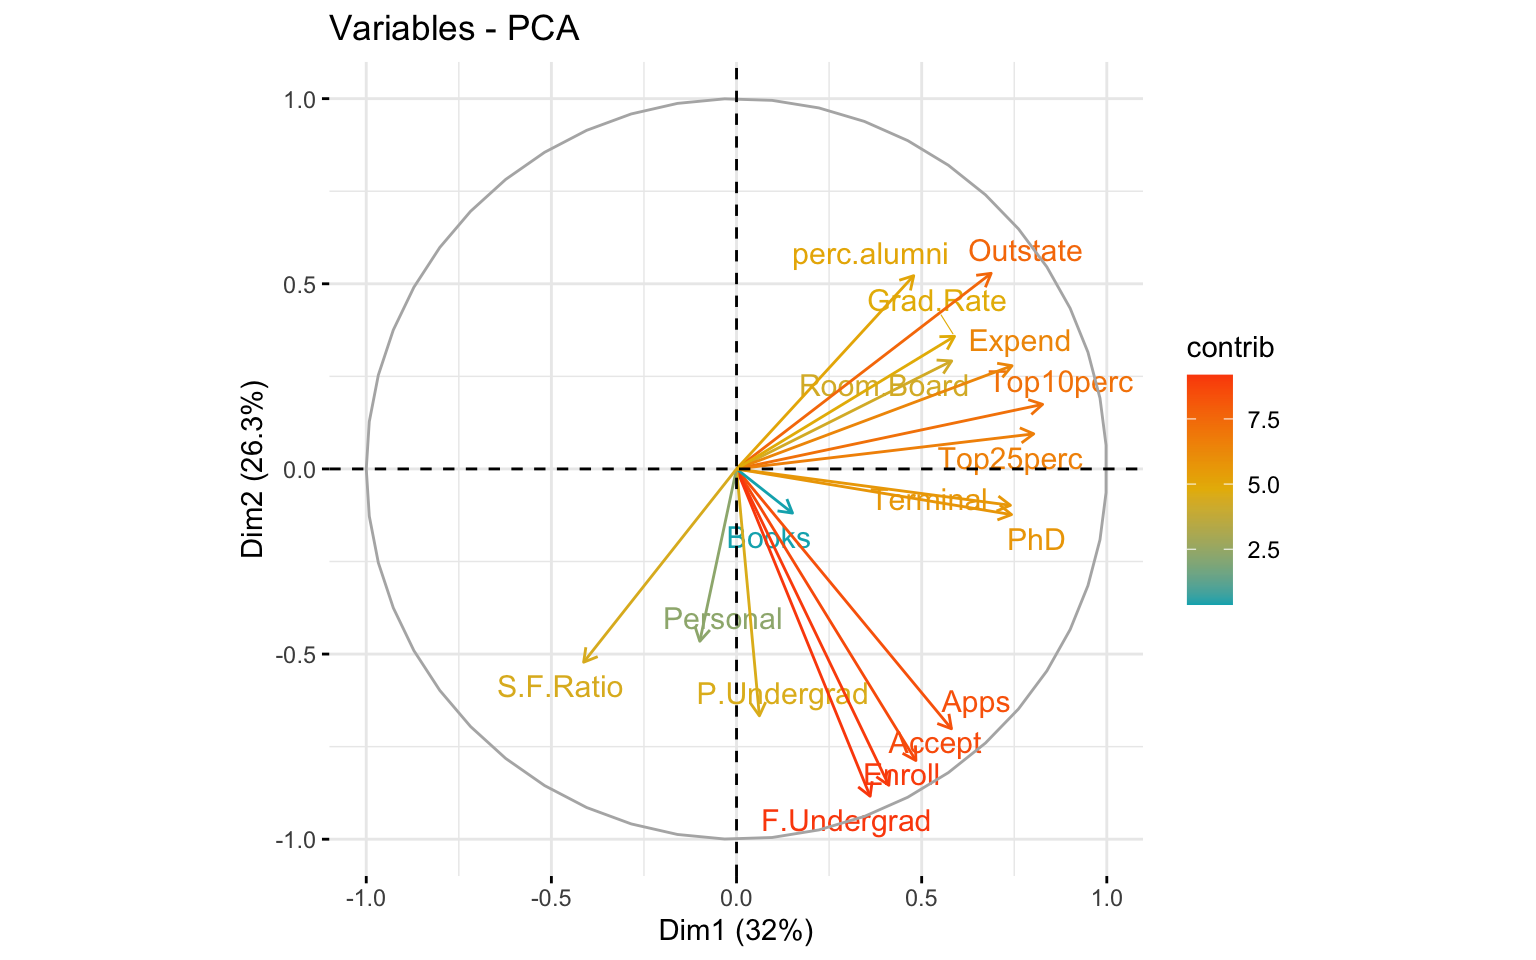
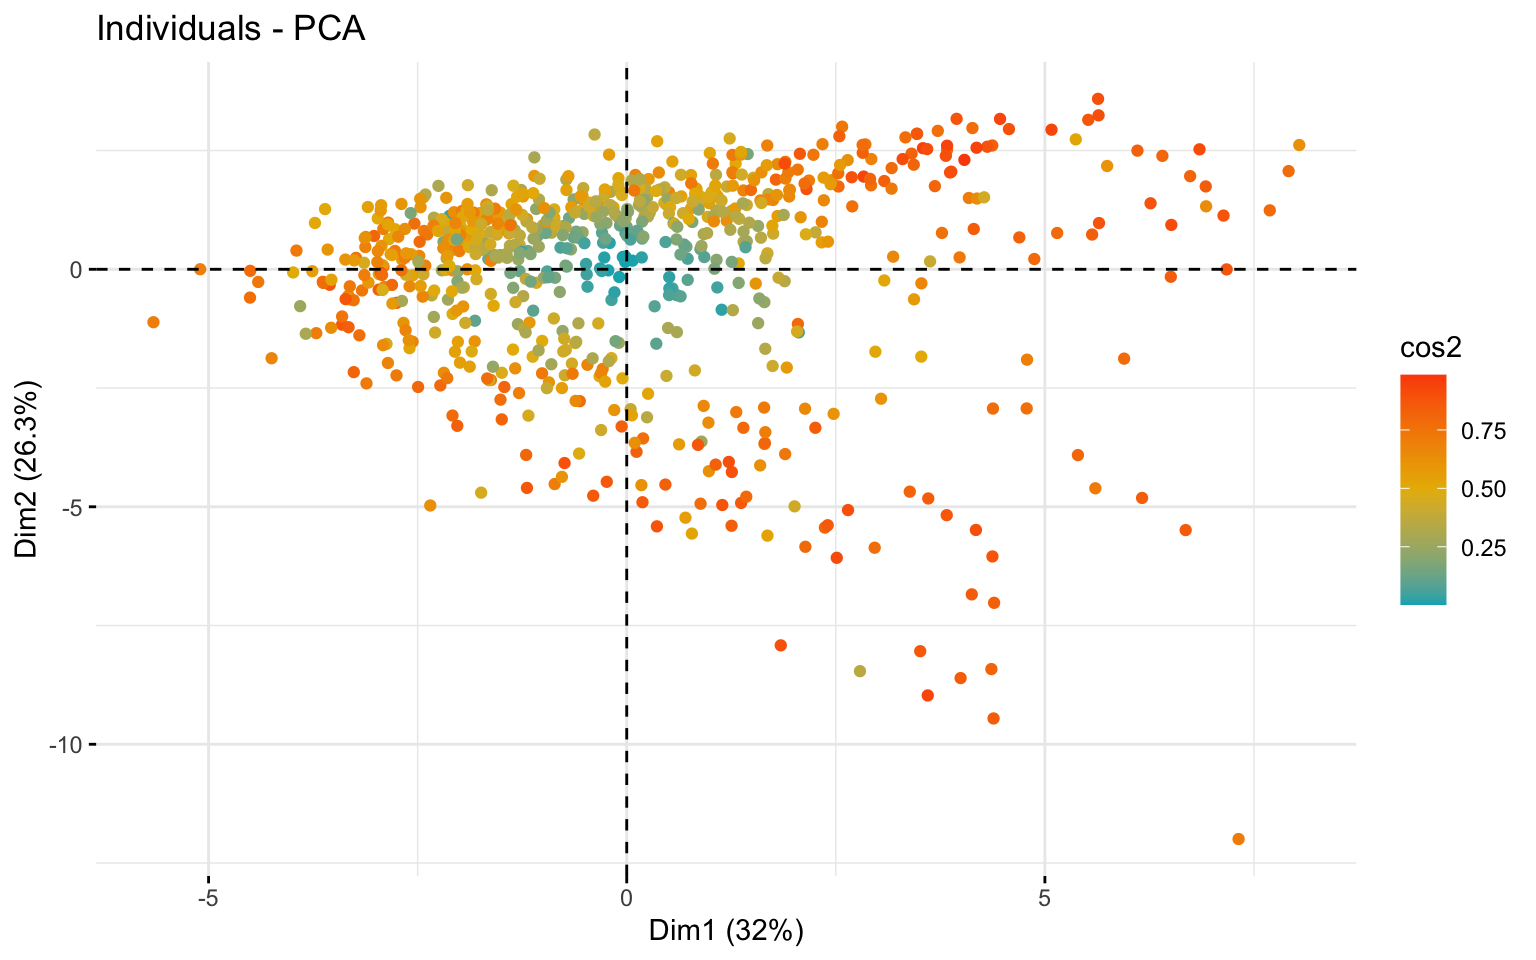
From the first biplot, we can see that Apps, Accept, Enroll, and F.Undergrad are the variables for which the first two principal components capture most of the variance. These variables are correlated, as indicated by the small angles between their arrows, which is confirmed by the correlation matrix. PC1 captures most of the variance of F.Undergrad and part of P.Undergrad, while PC2 captures some of the variance of Top25perc and Top10perc.
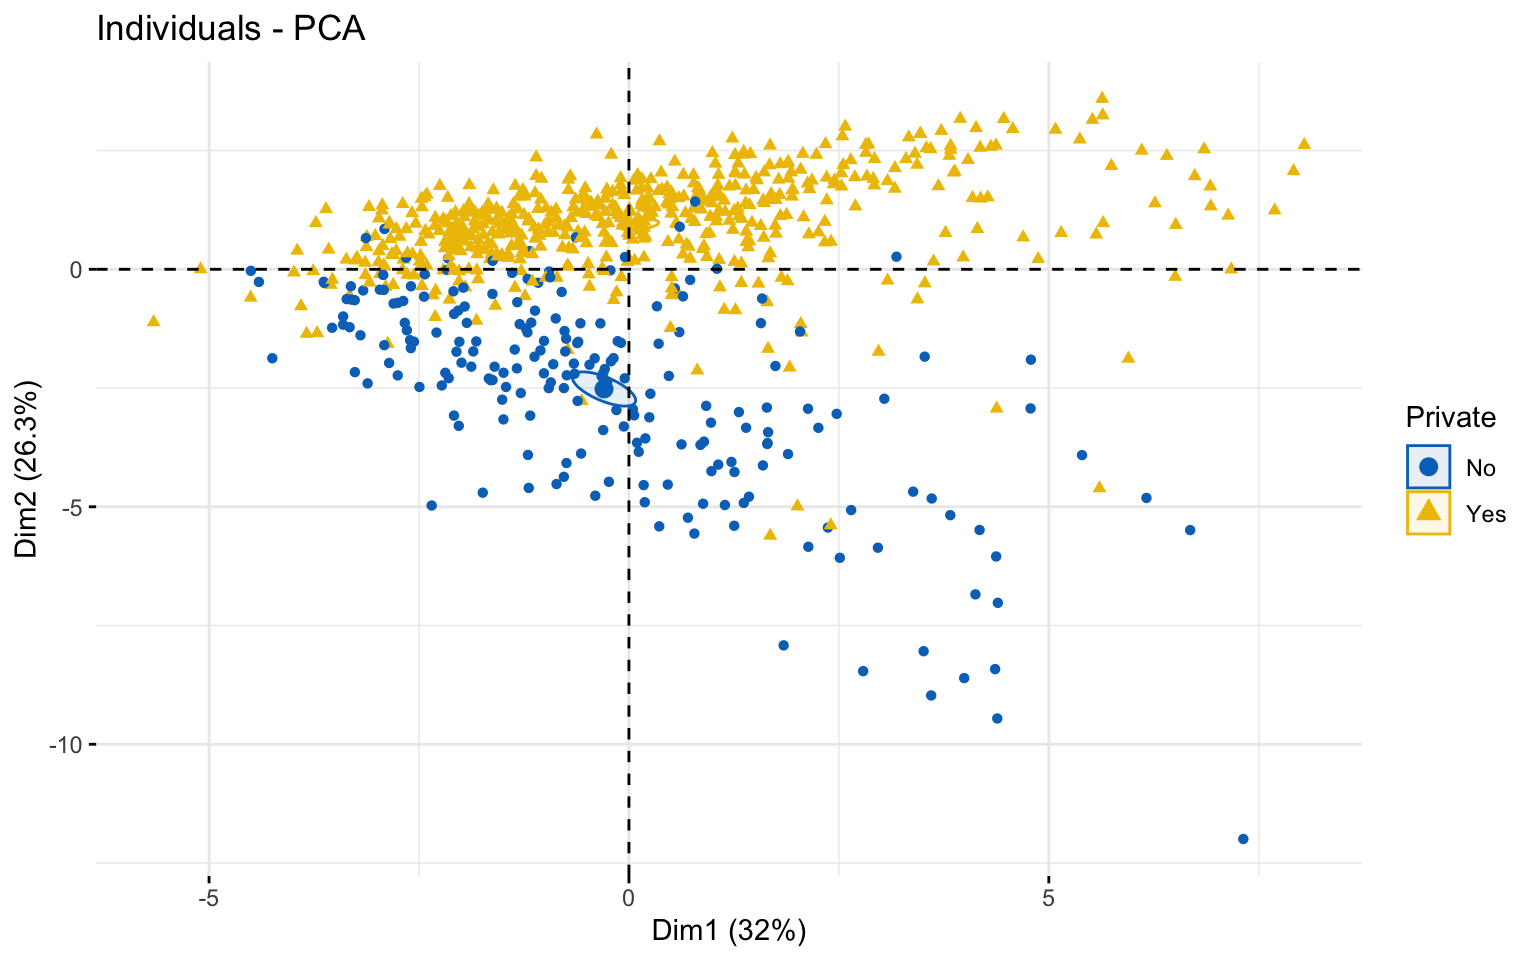
In the last plot, we can see that the second dimension separates the Private attribute quite well.
Eigenvectors
This table is useful to understand the orientation of the variables. A negative eigenvector value means that higher values of that variable are associated with lower values along the corresponding Principal Component axis in the transformed PCA space.
| PC1 | PC2 | PC3 | PC4 | PC5 | PC6 | PC7 | PC8 | PC9 | PC10 | PC11 | PC12 | PC13 | PC14 | PC15 | PC16 | PC17 | |
|---|---|---|---|---|---|---|---|---|---|---|---|---|---|---|---|---|---|
| Apps | 0.25 | -0.33 | 0.06 | 0.28 | -0.01 | -0.02 | 0.04 | 0.10 | 0.09 | 0.05 | -0.04 | -0.02 | -0.60 | 0.08 | -0.13 | 0.46 | 0.36 |
| Accept | 0.21 | -0.37 | 0.10 | 0.27 | -0.06 | 0.01 | 0.01 | 0.06 | 0.18 | 0.04 | 0.06 | 0.15 | -0.29 | 0.03 | 0.15 | -0.52 | -0.54 |
| Enroll | 0.18 | -0.40 | 0.08 | 0.16 | 0.06 | -0.04 | 0.03 | -0.06 | 0.13 | 0.03 | 0.07 | -0.01 | 0.44 | -0.09 | -0.03 | -0.40 | 0.61 |
| Top10perc | 0.35 | 0.08 | -0.04 | -0.05 | 0.40 | -0.05 | 0.16 | 0.12 | -0.34 | 0.06 | 0.01 | -0.04 | 0.00 | -0.11 | -0.70 | -0.15 | -0.14 |
| Top25perc | 0.34 | 0.04 | 0.02 | -0.11 | 0.43 | 0.03 | 0.12 | 0.10 | -0.40 | 0.01 | 0.27 | 0.09 | -0.02 | 0.15 | 0.62 | 0.05 | 0.08 |
| F.Undergrad | 0.15 | -0.42 | 0.06 | 0.10 | 0.04 | -0.04 | 0.03 | -0.08 | 0.06 | 0.02 | 0.08 | -0.06 | 0.52 | -0.06 | -0.01 | 0.56 | -0.41 |
| P.Undergrad | 0.03 | -0.32 | -0.14 | -0.16 | -0.30 | -0.19 | -0.06 | -0.57 | -0.56 | -0.22 | -0.10 | 0.06 | -0.13 | 0.02 | -0.02 | -0.05 | 0.01 |
| Outstate | 0.29 | 0.25 | -0.05 | 0.13 | -0.22 | -0.03 | -0.11 | -0.01 | 0.00 | 0.19 | -0.14 | 0.82 | 0.14 | -0.03 | -0.04 | 0.10 | 0.05 |
| Room.Board | 0.25 | 0.14 | -0.15 | 0.18 | -0.56 | 0.16 | -0.21 | 0.22 | -0.28 | 0.30 | 0.36 | -0.35 | 0.07 | -0.06 | 0.00 | -0.03 | 0.00 |
| Books | 0.06 | -0.06 | -0.68 | 0.09 | 0.13 | 0.64 | 0.15 | -0.21 | 0.13 | -0.08 | -0.03 | 0.03 | -0.01 | -0.07 | 0.01 | 0.00 | 0.00 |
| Personal | -0.04 | -0.22 | -0.50 | -0.23 | 0.22 | -0.33 | -0.63 | 0.23 | 0.09 | 0.14 | 0.02 | 0.04 | -0.04 | 0.03 | 0.00 | -0.01 | 0.00 |
| PhD | 0.32 | -0.06 | 0.13 | -0.53 | -0.14 | 0.09 | 0.00 | 0.08 | 0.19 | -0.12 | -0.04 | -0.02 | -0.13 | -0.69 | 0.11 | 0.03 | 0.01 |
| Terminal | 0.32 | -0.05 | 0.07 | -0.52 | -0.20 | 0.15 | 0.03 | 0.01 | 0.25 | -0.09 | 0.06 | -0.02 | 0.06 | 0.67 | -0.16 | -0.03 | 0.01 |
| S.F.Ratio | -0.18 | -0.25 | 0.29 | -0.16 | 0.08 | 0.49 | -0.22 | 0.08 | -0.27 | 0.47 | -0.45 | 0.01 | 0.02 | 0.04 | 0.02 | -0.02 | 0.00 |
| perc.alumni | 0.21 | 0.25 | 0.15 | 0.02 | 0.22 | -0.05 | -0.24 | -0.68 | 0.26 | 0.42 | 0.13 | -0.18 | -0.10 | -0.03 | 0.01 | 0.00 | -0.02 |
| Expend | 0.32 | 0.13 | -0.23 | 0.08 | -0.08 | -0.30 | 0.23 | 0.05 | 0.05 | 0.13 | -0.69 | -0.33 | 0.09 | 0.07 | 0.23 | -0.04 | -0.04 |
| Grad.Rate | 0.25 | 0.17 | 0.21 | 0.27 | 0.11 | 0.22 | -0.56 | 0.01 | -0.04 | -0.59 | -0.22 | -0.12 | 0.07 | 0.04 | 0.00 | -0.01 | -0.01 |
Percentage of variance in each principal component explained by the variables
Remember: each column is scaled by the variance captured by its component (the eigenvalue). For example, in PC17 the variable Enroll explains 37.17% of the variance of that component. However, PC17 itself captures only 0.14% of the total variance.
| PC1 | PC2 | PC3 | PC4 | PC5 | PC6 | PC7 | PC8 | PC9 | PC10 | PC11 | PC12 | PC13 | PC14 | PC15 | PC16 | PC17 | |
|---|---|---|---|---|---|---|---|---|---|---|---|---|---|---|---|---|---|
| Apps | 6.19% | 11% | 0.4% | 7.91% | 0% | 0.03% | 0.18% | 1.06% | 0.81% | 0.28% | 0.19% | 0.06% | 35.5% | 0.65% | 1.78% | 21.08% | 12.89% |
| Accept | 4.31% | 13.85% | 1.03% | 7.17% | 0.31% | 0.01% | 0.02% | 0.32% | 3.16% | 0.17% | 0.34% | 2.11% | 8.56% | 0.11% | 2.12% | 26.89% | 29.53% |
| Enroll | 3.11% | 16.3% | 0.69% | 2.62% | 0.31% | 0.18% | 0.08% | 0.34% | 1.65% | 0.12% | 0.48% | 0.01% | 19.77% | 0.73% | 0.09% | 16.35% | 37.17% |
| Top10perc | 12.55% | 0.68% | 0.12% | 0.27% | 15.64% | 0.28% | 2.6% | 1.5% | 11.63% | 0.41% | 0.01% | 0.15% | 0% | 1.16% | 48.68% | 2.21% | 2.1% |
| Top25perc | 11.83% | 0.2% | 0.06% | 1.2% | 18.19% | 0.11% | 1.4% | 1.05% | 16.3% | 0.02% | 7.46% | 0.8% | 0.05% | 2.3% | 38.1% | 0.27% | 0.65% |
| F.Undergrad | 2.39% | 17.45% | 0.38% | 1.01% | 0.19% | 0.19% | 0.06% | 0.62% | 0.35% | 0.04% | 0.66% | 0.32% | 27.42% | 0.32% | 0.01% | 31.4% | 17.2% |
| P.Undergrad | 0.07% | 9.93% | 1.95% | 2.51% | 9.14% | 3.66% | 0.37% | 32.58% | 31.44% | 4.98% | 1.01% | 0.4% | 1.59% | 0.04% | 0.04% | 0.28% | 0.01% |
| Outstate | 8.69% | 6.23% | 0.22% | 1.72% | 4.95% | 0.09% | 1.18% | 0.01% | 0% | 3.48% | 2.05% | 67.81% | 2.01% | 0.12% | 0.15% | 1.03% | 0.26% |
| Room.Board | 6.2% | 1.9% | 2.22% | 3.42% | 31.46% | 2.65% | 4.4% | 4.9% | 7.56% | 8.9% | 12.91% | 12.57% | 0.49% | 0.34% | 0% | 0.07% | 0% |
| Books | 0.42% | 0.32% | 45.89% | 0.76% | 1.62% | 41.1% | 2.24% | 4.55% | 1.79% | 0.67% | 0.1% | 0.08% | 0.01% | 0.45% | 0.01% | 0% | 0% |
| Personal | 0.18% | 4.84% | 24.97% | 5.32% | 4.94% | 10.98% | 40.17% | 5.41% | 0.89% | 1.85% | 0.03% | 0.15% | 0.16% | 0.08% | 0% | 0.02% | 0% |
| PhD | 10.13% | 0.34% | 1.61% | 28.59% | 1.96% | 0.83% | 0% | 0.59% | 3.43% | 1.52% | 0.16% | 0.05% | 1.63% | 47.77% | 1.26% | 0.09% | 0.02% |
| Terminal | 10.05% | 0.22% | 0.44% | 26.98% | 4.19% | 2.4% | 0.08% | 0.01% | 6.5% | 0.78% | 0.35% | 0.03% | 0.34% | 45.03% | 2.53% | 0.07% | 0% |
| S.F.Ratio | 3.13% | 6.08% | 8.4% | 2.6% | 0.63% | 23.72% | 4.81% | 0.7% | 7.54% | 22.28% | 19.8% | 0.01% | 0.03% | 0.17% | 0.04% | 0.05% | 0% |
| perc.alumni | 4.21% | 6.08% | 2.16% | 0.03% | 4.68% | 0.22% | 5.92% | 46.04% | 6.52% | 17.89% | 1.71% | 3.34% | 1.08% | 0.07% | 0.01% | 0% | 0.04% |
| Expend | 10.17% | 1.73% | 5.14% | 0.63% | 0.58% | 8.89% | 5.13% | 0.29% | 0.24% | 1.75% | 47.9% | 10.63% | 0.88% | 0.53% | 5.19% | 0.19% | 0.12% |
| Grad.Rate | 6.37% | 2.86% | 4.33% | 7.24% | 1.19% | 4.67% | 31.35% | 0% | 0.18% | 34.84% | 4.83% | 1.49% | 0.48% | 0.13% | 0% | 0% | 0.02% |
Percentage of variance of variables explained by each PC
| PC1 | PC2 | PC3 | PC4 | PC5 | PC6 | PC7 | PC8 | PC9 | PC10 | PC11 | PC12 | PC13 | PC14 | PC15 | PC16 | PC17 | |
|---|---|---|---|---|---|---|---|---|---|---|---|---|---|---|---|---|---|
| Apps | 33.69% | 49.24% | 0.47% | 7.97% | 0% | 0.02% | 0.11% | 0.62% | 0.43% | 0.11% | 0.06% | 0.01% | 5.95% | 0.09% | 0.16% | 0.77% | 0.3% |
| Accept | 23.46% | 62% | 1.2% | 7.22% | 0.29% | 0% | 0.01% | 0.19% | 1.68% | 0.07% | 0.11% | 0.46% | 1.44% | 0.02% | 0.19% | 0.99% | 0.68% |
| Enroll | 16.92% | 72.99% | 0.81% | 2.64% | 0.29% | 0.15% | 0.05% | 0.2% | 0.88% | 0.05% | 0.15% | 0% | 3.31% | 0.11% | 0.01% | 0.6% | 0.85% |
| Top10perc | 68.32% | 3.04% | 0.14% | 0.27% | 14.59% | 0.24% | 1.57% | 0.88% | 6.17% | 0.17% | 0% | 0.03% | 0% | 0.17% | 4.28% | 0.08% | 0.05% |
| Top25perc | 64.42% | 0.9% | 0.07% | 1.21% | 16.97% | 0.09% | 0.85% | 0.62% | 8.64% | 0.01% | 2.34% | 0.18% | 0.01% | 0.33% | 3.35% | 0.01% | 0.01% |
| F.Undergrad | 13.02% | 78.12% | 0.44% | 1.02% | 0.18% | 0.16% | 0.04% | 0.37% | 0.19% | 0.02% | 0.21% | 0.07% | 4.59% | 0.05% | 0% | 1.15% | 0.4% |
| P.Undergrad | 0.38% | 44.46% | 2.29% | 2.53% | 8.53% | 3.1% | 0.23% | 19.13% | 16.66% | 2.01% | 0.32% | 0.09% | 0.27% | 0.01% | 0% | 0.01% | 0% |
| Outstate | 47.29% | 27.91% | 0.25% | 1.74% | 4.62% | 0.08% | 0.71% | 0.01% | 0% | 1.41% | 0.64% | 14.94% | 0.34% | 0.02% | 0.01% | 0.04% | 0.01% |
| Room.Board | 33.76% | 8.5% | 2.6% | 3.45% | 29.36% | 2.24% | 2.66% | 2.88% | 4.01% | 3.59% | 4.04% | 2.77% | 0.08% | 0.05% | 0% | 0% | 0% |
| Books | 2.28% | 1.42% | 53.83% | 0.76% | 1.51% | 34.82% | 1.36% | 2.67% | 0.95% | 0.27% | 0.03% | 0.02% | 0% | 0.06% | 0% | 0% | 0% |
| Personal | 0.98% | 21.66% | 29.3% | 5.36% | 4.61% | 9.31% | 24.3% | 3.18% | 0.47% | 0.75% | 0.01% | 0.03% | 0.03% | 0.01% | 0% | 0% | 0% |
| PhD | 55.16% | 1.52% | 1.89% | 28.79% | 1.83% | 0.71% | 0% | 0.35% | 1.82% | 0.62% | 0.05% | 0.01% | 0.27% | 6.87% | 0.11% | 0% | 0% |
| Terminal | 54.72% | 0.97% | 0.51% | 27.17% | 3.91% | 2.03% | 0.05% | 0.01% | 3.44% | 0.32% | 0.11% | 0.01% | 0.06% | 6.47% | 0.22% | 0% | 0% |
| S.F.Ratio | 17.05% | 27.24% | 9.86% | 2.62% | 0.59% | 20.1% | 2.91% | 0.41% | 3.99% | 9% | 6.2% | 0% | 0.01% | 0.02% | 0% | 0% | 0% |
| perc.alumni | 22.89% | 27.23% | 2.53% | 0.03% | 4.37% | 0.19% | 3.58% | 27.03% | 3.45% | 7.22% | 0.53% | 0.74% | 0.18% | 0.01% | 0% | 0% | 0% |
| Expend | 55.36% | 7.77% | 6.03% | 0.63% | 0.54% | 7.53% | 3.11% | 0.17% | 0.13% | 0.71% | 14.99% | 2.34% | 0.15% | 0.08% | 0.46% | 0.01% | 0% |
| Grad.Rate | 34.66% | 12.83% | 5.08% | 7.29% | 1.11% | 3.96% | 18.97% | 0% | 0.09% | 14.07% | 1.51% | 0.33% | 0.08% | 0.02% | 0% | 0% | 0% |
In conclusion, there are some variables are strongly associated with the first two components (e.g., Apps, Accept, Enroll, F.Undergrad), while others load more heavily on different dimensions (e.g., Books on PC3 and PC6, Personal on PC3 and PC7). This suggests that the first components capture most of the information related to student admission and enrollment processes, while later components capture variability associated with more specific factors, such as expenditures, personal costs, or academic staff ratios.
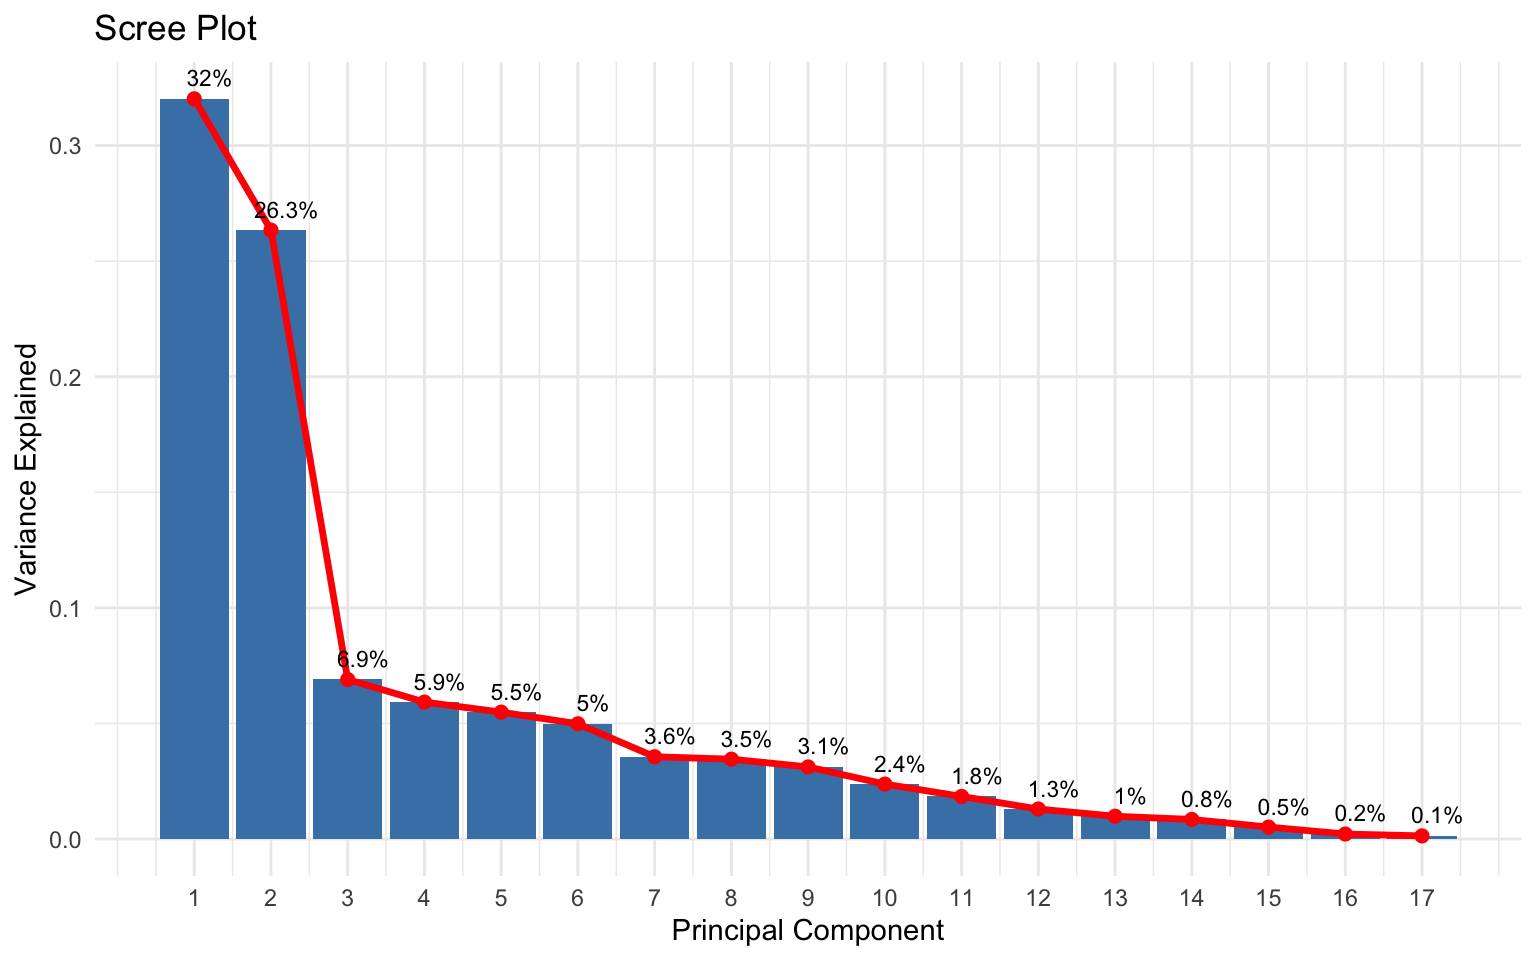
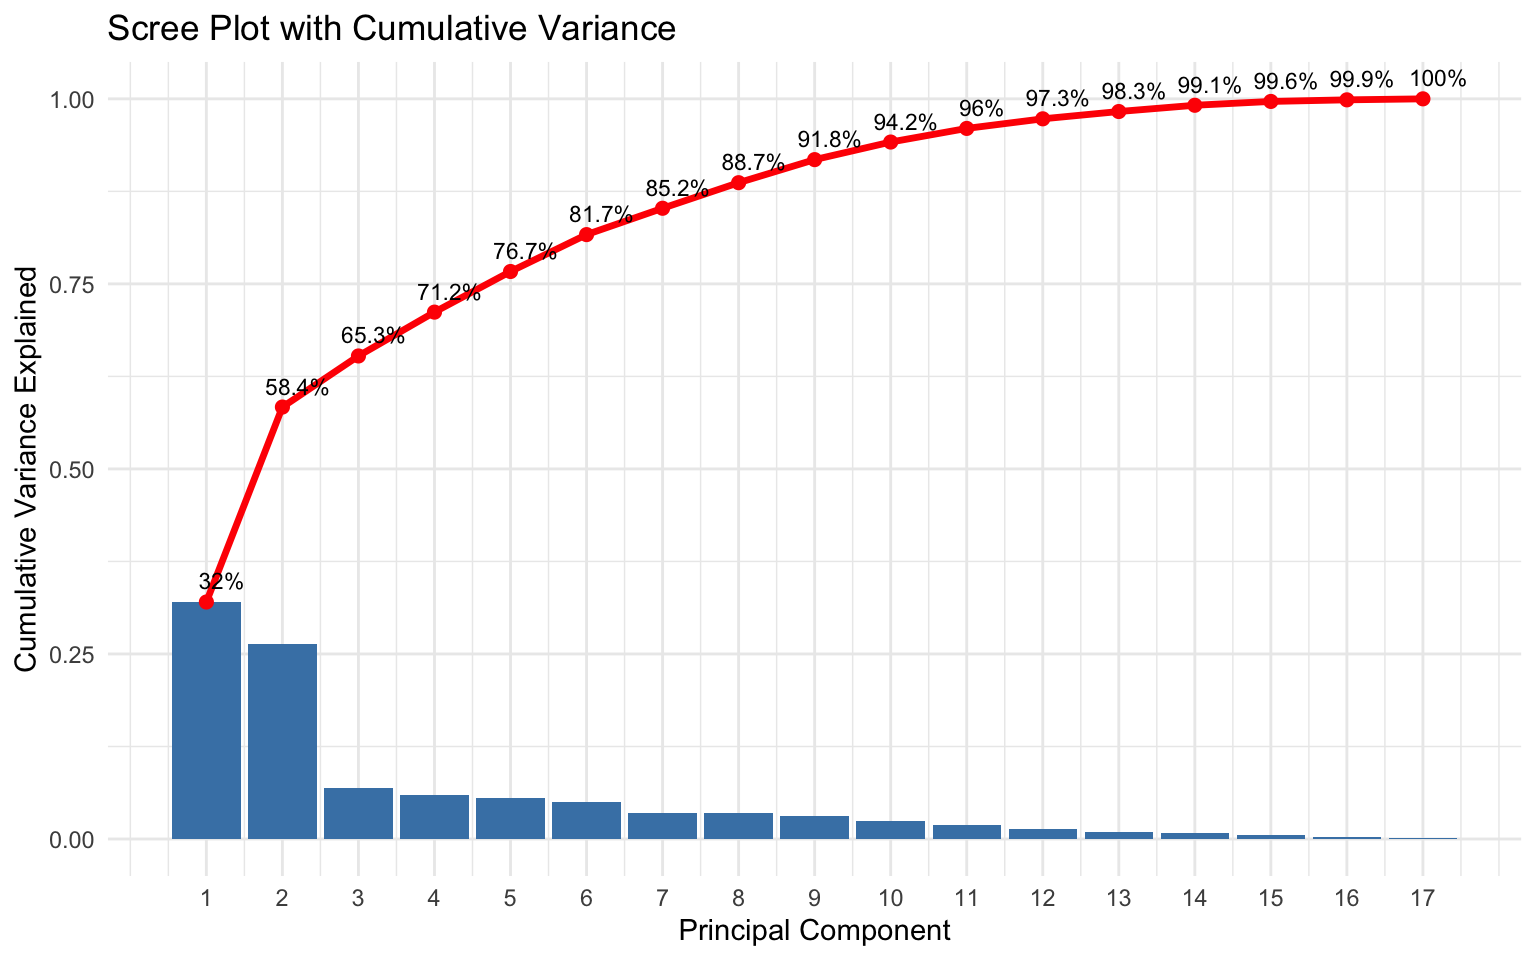
Choosing the number of PCs
Let’s apply Kaiser’s rule
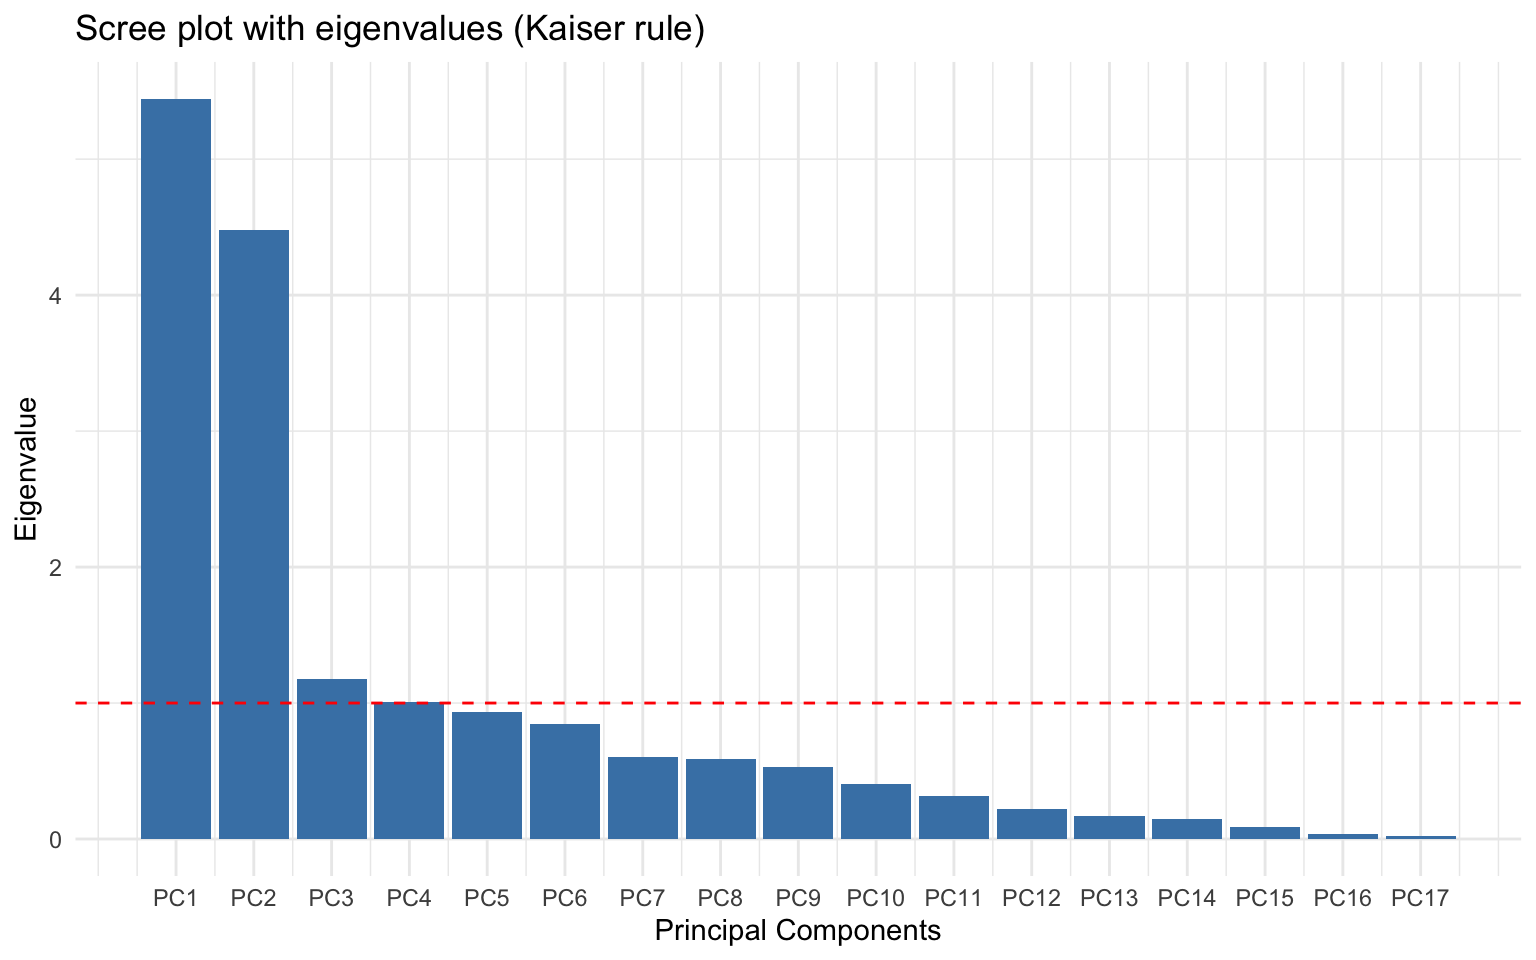
The PC four is on the line and the variable that it explain better are inside the first PC.
Then we select only the first 3 components:
- PC1 – Academic Prestige and Student Spending: This component captures the level of academic prestige and quality of a college. High values indicate selective institutions with good resources and qualified faculty.
- PC2 – Size and Enrollment Volume: This component appears to reflect the size of the institution and the scale of its admissions process. Low values correspond to large, highly attended colleges.
- PC3 – Personal and Book Expenses: Personal and Book Expenses: A component that seems to reflect student-related out-of-pocket expenses. Negative values indicate higher costs for personal living and study materials.